


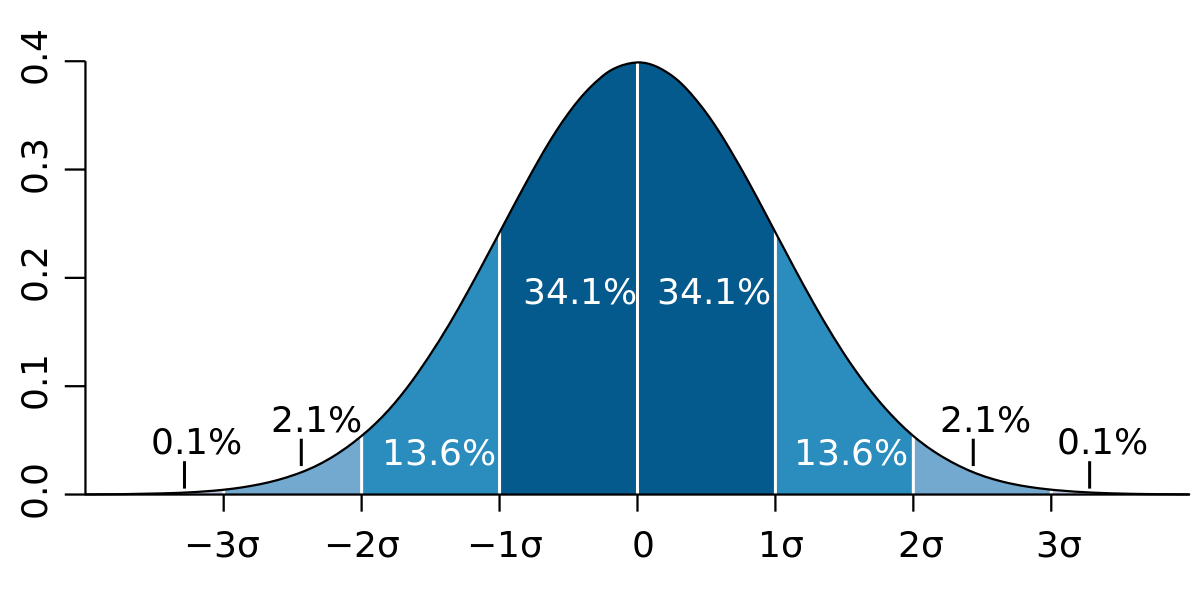
Statistics is a field of mathematics that studies the collection, analysis, interpretation, presentation, and organization of data in a certain way. Statistics is described as the process of collecting data, categorizing data, portraying info with proper explanation, and analyzing the data extensively. Statistics is often defined as drawing inferences from sample data acquired via survey data or trials. It is used in a variety of fields, including psychology, sociology, geology, probability, and so on. The standard deviation is a statistic that quantifies a dataset’s distribution compared to its average. In statistics, the standard deviation is a measure of dispersion.
Also Read: Why does galaxy m32 have the segment best display
The term “dispersement” refers to how far your data is scattered. It demonstrates how much your data is spread out around the mean or average. In actual life, a normal distribution curve might reflect hundreds of different scenarios. Have you ever observed in class that the majority of students receive Cs, while just a handful receive As or Fs? A bell curve can be used to model this. Similar graphs may be used to stimulate people’s weights, heights, dietary habits, and exercise routines. This information helps businesses, schools, and governments to forecast future behaviour.
What Is Mathematical Statistics?
Statistics is primarily used to achieve a better understanding of data and to focus on specific applications. Statistics is the procedure for accumulating, analyzing, and summarising data into a numerical expression. Originally, statistics were associated with social research, where it was employed in the gathering and analysis of information and statistics about a nation, such as its commerce, demographics, and so forth. Mathematical statistics use analytical models such as algebra, discrete mathematics, applied mathematics, and probability concepts.
In mathematical statistics, there are two approaches for analyzing data that are widely used:
- Descriptive Statistics
- Inferential Statistics
1) Descriptive Statistics – This descriptive and inferential statistical approach is used to describe and summarise the data and its features using measures of central trends and measures of dispersion.
2) Inferential Statistics – This statistical approach is used to derive inferences from data. Inferential statistics necessitates statistical tests and experiments, and it derives inferences by finding differences between the groups. Tests compute the p-value, which is then compared to the probability of chance() = 0.05. If the p-value is less than, the p-value is considered statistically significant.
How To Measure Dispersion In Statistics?
The measurements of central tendency are insufficient to represent all of the information about a particular set of data. As a result, we must describe the variability using a number known as the measure of dispersion. The various dispersion measures are as follows:
- In statistics, the range is computed as the difference between the highest and minimum values of the data points.
- The quartile deviation can also be termed as the absolute measure of dispersion. The data is split into three halves. Calculate the median of the data points. The higher quartile is defined as the median of the data points to the left of this median, and the lower quartile is defined as the median of the data points to the right of this median. The interquartile range is referred to as Upper quartile – lower quartile in statistics. The other half of the data points is its quartile deviation.
- The average deviation can be termed as the statistical measure that is used to depict the mean of the absolute difference between the items in a distribution and the mean or median of that series.
- The standard deviation can be termed as the value of variation amount for a given set of values.
Conclusion
This article will help readers understand the significance of these two essential aspects of statistics. Cuemath, an online platform created to aid learners with their math problems, can be of great assistance. It deals with a variety of coding and mathematical issues. Because of its effective problem-solving capabilities, experienced teachers suggest this platform. This article will educate readers on these two fundamental aspects of statistics.


+ There are no comments
Add yours